Coastal Watershed Spotlight: Pamlico Subbasin HUC 12 030201050207
For this "sub watershed" of the blog, I'm going to focus on the Pamlico Sound-Ocracoke Inlet Subbasin in Eastern North Carolina. One of my favorite places to be is Ocracoke Island in the outer banks of North Carolina. I've always been curious how these coastal watersheds work when there is ocean separating them from the mainland. Turns out, the Pamlico-Ocracoke Inlet subbasin, part of the larger Tar-Pamlico basin, holds the southern portion of the island. I'm going to spend the semester diving into this watershed and exploring (both in-person and online) the creeks, sounds, and inlets here.
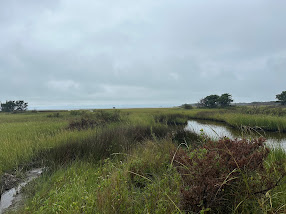
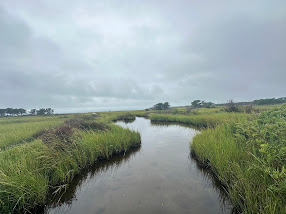
Screenshot from my iPhone 9.8.24

Kayaking Trip in the creeks of Ocracoke 9.8.2024. Image Credit (all): Josselyn Lucas 2024
Delineating a catchment (watershed)
The Pamlico-Ocracoke Inlet subbasin, is part of the larger Tar-Pamlico River Basin, the fourth largest in North Carolina that originates in the north-central part of the state, and flowing southeast before emptying into the Pamlico Sound (
Tar-Pamlico Basin Wide Water Resources Management Plan). The smaller Pamlico-Ocracoke Inlet subbasin covers coastal areas that include the Pamlico Sound, the Ocracoke Inlet north of Portsmouth, and creeks and inlet systems flowing towards the Atlantic Ocean from Ocracoke Island. The hydrology of this subbasin is influenced by tidal waters and the Pamlico Sound, where freshwater from rivers like the Pamlico mix with saltwater. This creates a complex estuarine system, with wetlands, marshes, beaches, and the barrier islands playing critical roles in water flow, nutrient cycling, and habitat for wildlife.
While on Ocracoke, I kayaked through creeks and sloughs and explored parts of Pamlico Sound near the shore. This inspired me to take a close look at a smaller catchment to get a more intimate understanding of the area.
One of the highlights of my trip was
Springers Point Preserve, a nature preserve managed by the
Coastal Land Trust near the southern tip of Ocracoke. It’s truly one of my favorite places on earth—so peaceful and seemingly untouched, with massive, sprawling live oaks, marshlands that paint the landscape in a patchwork of green, purple, and yellow forbs, and dense scrubby underbrush lining the sandy, well-worn trails. The preserve is home to winding creeks, an evergreen maritime forest, small picturesque beaches, secluded inlets, and vast marshlands. I spent most of my time paddling through Old Slough, a stunning creek system with clear blue water teeming with fish, hermit crabs, shorebirds, and lush vegetation.
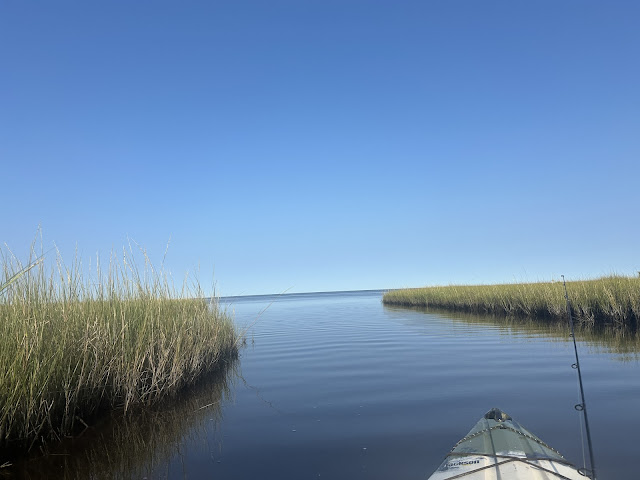
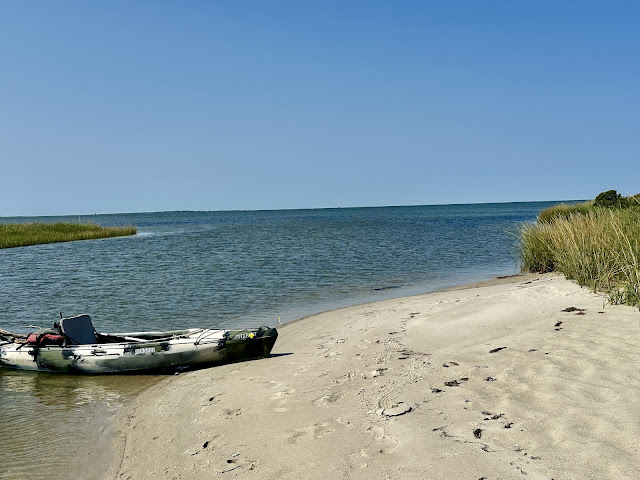
All Photos below were taken by me on 9.10.24
Kayaking toward the Pamlico Sound through a narrow and shallow creek
Entering the Sound
View of the Ocracoke Lighthouse from the Pamlico Sound
"Secret" beach around Springers Point - just north of the Mouth of Old Slough. Driftwood heaven.
Exploring the secret beach
Exploring Secret Beach and Playing with my iPhone capabilities
Secret Beach # 2 - There were hundreds of hermit crabs here
Marshes holding Old Slough, and Evergreen Maritime Forest of Springer's Point
Old Slough creek outlet
Marshes around Springers Point
Live Oaks on Springers Point looking out into the sound
"Old Slough" - That's my husband out there in the center
Me playing around. You can see the driftwood I collected in the back of the kayak.
I decided to try delineating the Old Slough catchment the old-school way using ArcGIS Pro, something I hadn’t done before. As expected, there weren't many topo lines beyond the sand dunes along the beach, making the process more challenging than I anticipated. Fortunately, I found some 1-foot contours and managed to complete what I believe is a decent delineation.
After finishing, I used StreamStats to compare my results. If you haven’t heard of StreamStats, it’s worth checking out. As I mention in the video, it’s a convenient tool created by the US Geological Survey (USGS) for fast watershed delineations. Beyond that, it provides useful data like percent land cover, peak flow statistics, and more, all neatly packaged in a downloadable PDF report.
There was a noticeable difference between my delineation and what the USGS showed. Watch the short video below for my personal explanation.
Screenshot of one foot contours I downloaded to help me with the delineation
My Delineation Results
Ultimately, I ended up mapping it like this:
And here's one of the photos I took at the mouth of Old Slough, on the map:
When I measured it, the catchment came out to be 0.83 square miles, or around 530 acres. The streamstats report came back as 0.39 square miles - a significant difference for a small watershed. Here's the streamstats report so you can see the other interesting information, like landcover.
So, was I successful? Maybe, maybe not. I was close. All in all it was an interesting exercise, and at the very least I learned how to do it, and had a fun time in the process.
Watershed Special Characteristics - A Diversity of Habitats
The Pamlico-Ocracoke Inlet Subbasin is a fascinating mosaic of landcover types, each contributing uniquely to the region’s ecological and cultural richness. Detailed data on this watershed doesn't really exist - by that I mean, there is no website I can go to to get landcover acreages and habitat types of the catchment. What a great opportunity to do some research!
To calculate the land cover percentages, I used data from the National Land Cover Database (NLCD) and analyzed with GIS tools (specifically raster calculator). Spanning approximately 29,701 acres, the Pamlico-Ocracoke Inlet watershed is a striking landscape dominated by open water, which comprises 86.31% of its area. These waters harbor critical habitats such as deep ocean zones, seagrass beds, and estuaries. On land, the diversity continues: beaches, mud flats, and dunes provide crucial habitats for shorebirds, while maritime forests and woody wetlands serve as vital breeding grounds for wildlife (NC Wildlife Resources Commission, 2024). Emergent wetlands, the second-largest landcover type in the watershed, are essential for sustaining fisheries and buffering the coast against wave energy (NC Wetlands, 2024).
Human habitat - homes and other infrastructure - is interwoven with these coastal areas, and subject to frequent flooding and storm damage. The habitats mentioned above serve as the first line of defense against storms and floodwaters. However, as human activities expand in coastal regions, we continue to lose vital salt marshes and woody wetlands—habitats critical not only for biodiversity but for our own survival. This relationship highlights the irony of how our actions jeopardize not only the future of these ecosystems - but ours as well.
I created a series of slides exploring the landcover and habitat types within this area, offering insights into the natural beauty and touching on some of the challenges they face. Through this visual journey, I hope to spark curiosity about these habitats, raise awareness of their importance, and emphasize the deep interconnection we share with these remarkable ecosystems.
Works Cited
NC Coastal Federation. “Salt Marsh.” North Carolina Coastal Federation, https://www.nccoast.org/salt-marsh/. Accessed 3 December 2024.
Turning our Eyes toward the Mountains
I call Boone, North Carolina, home. It's a small mountain town nestled in the western part of Watauga County, near the Tennessee state line. Like much of our region, Boone is known for its natural beauty and the strong sense of connection we share, rooted in our Appalachian heritage.
On September 27th, Hurricane Helene swept through Western NC, Eastern Tennessee, Southwestern Virginia, and parts of Georgia and South Carolina. The aftermath was staggering: catastrophic flooding, widespread power outages, the collapse of communication networks, and the destruction of thousands of homes(Marshall, 2024). Community infrastructure and transportation networks were deteriorated or destroyed, and several counties were left without a public water supply for 52 days. Today, some of my friends and family in Asheville are still worried about traces of heavy metals or other pollutants in their drinking water, although it has been declared safe to drink.
In North Carolina alone, these communities are still grieving the loss of over 100 lives (Hurricane Helene Storm Related Fatalities | NCDHHS, 2024), and at least 10 missing people (Luck & Vernon, 2024). Beyond this vast destruction, we’ve lost something less tangible but deeply felt—our sense of safety, normalcy, and familiarity. Life here will never be the same.
In light of this tragedy, my focus has shifted. I’ve decided to pivot from my work on the Pamlico-Ocracoke Inlet watershed to concentrate some of my focus on the watershed in my own backyard—quite literally. When particularly relevant, I’ll be focusing much of my research and discussions on the South Fork New River watershed, HUC 050500010202, a place central to my daily life, and now more than ever, deserving of care and attention.
NOTE: The next section, Dendrology, will focus on the Pamlico-Ocracoke Inlet watershed
Dendrology
For our dendrology introduction I'll be focusing on the Pamlico Sound-Ocracoke Inlet sub-basin because I started my dendrology research prior to the Hurricane.
Flooding in the High Country
My research focuses on flooding in the South Fork New River Basin; an area where water levels frequently rise but rarely reach catastrophic levels. However, Hurricane Helene was an exception, bringing unprecedented devastation to unprepared local communities. While floods of this magnitude are rare in the mountains of North Carolina, historical records reveal similarly destructive events dating back to the early 20th century.
The South Fork New River originates in Watauga County near Boone, NC, and flows through Ashe County, NC before flowing north into Southwestern Virginia. This interview with a local Ashe County resident highlights the flooding from the South Fork New River, and demonstrates the false sense of security many Western North Carolinians felt before the storm, and the shock they endured afterward. Ashe County footage starts at 1:55 for those of you who don't want to watch the entire video.
Hydrograph of South Fork New River on 12.20.2024
As shown above, on September 27, 2024, the South Fork New River crested at 18.22 feet—its highest stage for the year, and the highest recorded stage since 1940. Although this hydrograph only displays data from May to November 2024, it highlights the extraordinary nature of this flood event. The damages were severe, including the complete destruction of homes, widespread disruption to transportation networks, significant damage to community infrastructure, loss of major utilities, and, tragically, the loss of lives.
Below: Precipitation leading up to Helene - September 25th-27th, 2024. From NC State Climate Office
In the 48 hours leading up to Hurricane Helene, certain areas received over 18 inches of rain. This rainfall caused widespread flooding, fallen trees, and devastating landslides across the western North Carolina mountains.
The resulting flooding has been compared to two historic events in the South Fork New River Basin: the 1940 flood, during which the SFNR gauge crested at 22.5 feet, and the 1916 flood, when it reached 18 feet (NOAA).
Below: Precipitation leading up to the flood of 1916. From: WRAL.com In July 1916, western North Carolina experienced unprecedented rainfall from two tropical storms, with over 22 inches of precipitation recorded in 24 hours in some areas. This deluge caused rivers like the South Fork New River to overflow, leading to catastrophic flooding that devastated communities, destroyed infrastructure, and resulted in the loss of 80 lives across the region, and causing damages exceeding $20 million (NC DNCR). The flood's impact was so profound that it became a defining event for the region, called "the flood by which all other floods are measured"(Bisesi, 2024) with survivors' stories enduring for generations. The South Fork New River crested at 18 feet during this flood (NOAA).
1916 Flood - Photography Courtesy of State Archives of North Carolina
1916 Flood, Asheville - Photography Courtesy of State Archives of North Carolina
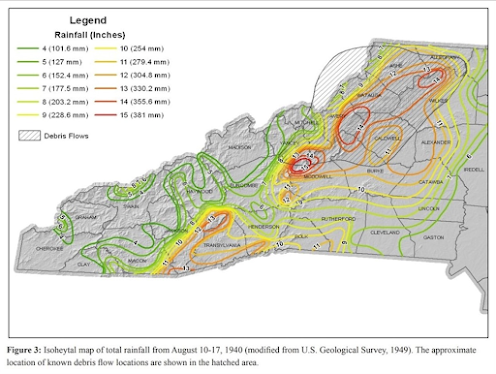
In August 1940, a Category 2 hurricane struck near Beaufort, South Carolina, bringing intense rainfall to western North Carolina. After a month of rain had brought over 21 inches of rain to the region, the storm delivered and additional eight inches of rain in Boone within 48 hours. The South Fork New River crested at a record 22.5 feet, its highest level ever recorded. Catastrophic flooding submerged parts of downtown Boone, and the deluge triggered more than 600 landslides in southeastern Watauga County alone. Infrastructure such as roads, bridges, and railways was swept away, isolating communities. The disaster claimed at least 16 lives, destroyed countless homes, and caused untold economic damage (Gerard et al., 2018). The flood of 1940 left a permanent mark on the region, and is remembered as one of the most devastating natural disasters in its history.
The history of flooding in the South Fork New River Basin shows how vulnerable this region is and the toll these events take on local communities. From the devastating floods of 1916 and 1940 to the destruction caused by Hurricane Helene in 2024, these disasters have left lasting marks on the land, infrastructure, and lives of the people who live here. While floods of this size are rare in the Appalachian Mountains, they remind us that we’re not immune to extreme weather. By looking back at these events—examining rainfall patterns and how communities were affected—we can prepare for the future and work toward building resilience for the High Country.
Works Cited
Bisesi, R. (2024, October 4). A century before Helene, the great flood of 1916 left NC's mountains drenched. WRAL.com. Retrieved December 20, 2024, from https://www.wral.com/story/a-century-before-helene-the-great-flood-of-1916-left-nc-s-mountains-drenched/21655739/
Gerard, P., Lucas, J. W., King, L. H., & Grey, J. (2018, March 26). The 1940s: The Deluge of 1940 | Our State. Our State Magazine. Retrieved December 20, 2024, from https://www.ourstate.com/the-deluge-of-1940/
NC DNCR. (2016, July 14). The Flood of 1916 and Unprecedented Destruction in Western North Carolina. NC DNCR. Retrieved December 20, 2024, from https://www.dncr.nc.gov/blog/2016/07/14/flood-1916-and-unprecedented-destruction-western-north-carolina
NOAA. (n.d.). South Fork New River near Jefferson. National Water Prediction Service. Retrieved December 20, 2024, from https://water.noaa.gov/gauges/jfrn7
Watershed Group Spotlight: MountainTrue's Watauga Riverkeeper Program
Challenges for the New River after Helene
I created some printable pamphlets that could be used to raise awareness and motivate action for people to support recovery in the New River watershed after Helene.
Challenges in the New After Helene
If you are not affiliated with Virginia Tech and would like a printable .pdf please email me at Josselyn@vt.edu.
Invasive Species Spotlight: Giant Hogweed
Watershed Monitoring Equipment
Floodplain Mapping
Given the vast size of the South Fork New River watershed, I decided to focus on an area closer to home. Howard’s Creek, a headwater tributary to the South Fork, caught my attention after witnessing the devastation it caused in my neighborhood during Hurricane Helene. The storm revealed the raw power of what is usually a serene, tumbling trout stream. My neighbors and I were stunned to see how far the flooding extended—reaching areas well beyond the 100-year floodplain, and even into parts of the 500-year floodplain.
Let’s unpack those “100-year” and “500-year” floodplain designations—they can be pretty misleading. These terms don’t mean that flooding only happens once every 100 or 500 years. Instead, they refer to probabilities: a 100-year floodplain has a 1% annual chance of flooding, while a 500-year floodplain has a 0.2% annual chance.
To put it in perspective, if you’re in a 100-year floodplain, there’s a statistical probability of flooding about 3.65 days a year. For a 500-year floodplain, that probability drops to roughly one day a year (0.73 days).
However, these calculations don’t account for our rapidly changing climate. With more intense precipitation events becoming the norm, I often wonder how reliable these designations really are. The environment is in constant flux, and the risks are predicted to increase.
For my investigation I visited FEMA's
Floodmap Service Center a resource for generating Flood Insurance Rate Maps (FIRMs). These maps cover entire panels of interest and also offer "FIRMette" options—a zoomed-in version with more detailed information. FIRMs are designed for communities and highlight special flood hazard areas and flood zones.
FEMA FIRM Panel of my area of interest
In the FIRM above, the faint blue areas represent the zones most vulnerable to flooding. To make the map easier to interpret, I included a screenshot of the zoomed-in legend (on the left). While the legend provides detailed designations, the terminology can be confusing and isn’t always intuitive for the average person. Understanding flood zones often requires additional research or guidance, which highlights the need for better communication about these designations.
Take "Zone X (Other Flood Areas)" as an example from the map. At first glance, it appears to cover everything outside the most critical flood zones, which might give one a false sense of security. However, the description tells a different story. It includes areas with a 0.2% annual chance of flooding, areas with a 1% annual chance but average flood depths of less than one foot, areas with drainage basins smaller than one square mile, and areas protected by levees from a 1% annual chance flood.
To make matters more confusing, "Zone X (Other Areas)" is described as being completely outside the 0.2% annual chance flood. Grouping multiple scenarios under the same zone class creates ambiguity and makes it harder to fully understand the true flood risks.
I also downloaded the
FIRMette, shown above, which is more detailed and easier to read than the full FIRM. However, it’s still challenging for the average person to interpret. If you don’t understand terms like “base flood elevation” or how a 1% or 0.2% annual flood translates into real-world scenarios, these maps don’t make it easy to grasp your flood risk. For researchers, scientists, and environmental professionals, FIRMs can be valuable tools for identifying flood zone designations. They’re also helpful for developers and municipalities to plan and mitigate risk. However, without significant updates, FIRMs are unlikely to be reliable predictors of flood risk in the face of intensifying climate change and increasingly extreme weather patterns.
This map reveals a troubling reality: many residences and entire neighborhoods are already located within special flood hazard areas, the 1% annual chance flood zones. During Hurricane Helene, many homes in these zones were either completely swept away or severely damaged by the floodwaters. Fields and lawns were buried under feet of sediment, rock, and mud, and tragically, one person lost their life just upstream of this mapped area. This reality calls for a reevaluation of how we approach development in vulnerable areas, and should encourage communities to prioritize resilience and plan for a safer future.
If these maps are meant to be used by communities to guide zoning decisions, they should prioritize the protection of the of the citizens, and focus on building resilience against future events. In an ideal world, no homes or roads would exist within special flood hazard areas. Instead, these spaces would be preserved as naturally vegetated forests, floodplain wetlands, and meadows. These natural areas wouldn’t just reduce property damage and save lives during extreme storms—they would also help mitigate the impact of floodwaters on downstream communities.









Comments
Post a Comment